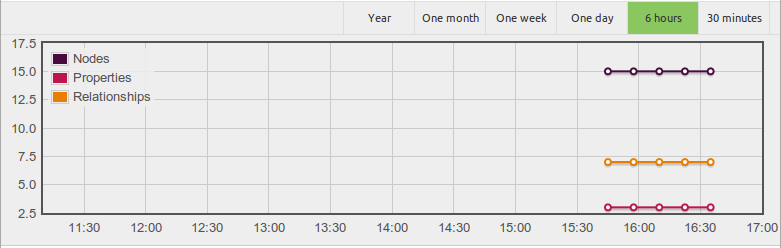
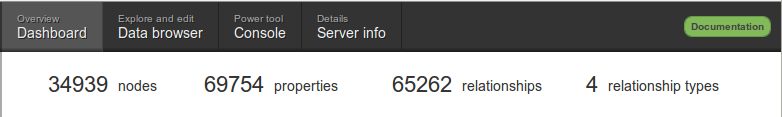
The Dashboard tab provides an overview of a running Neo4j instance.
The charts show entity counts over time: node, relationship and properties.
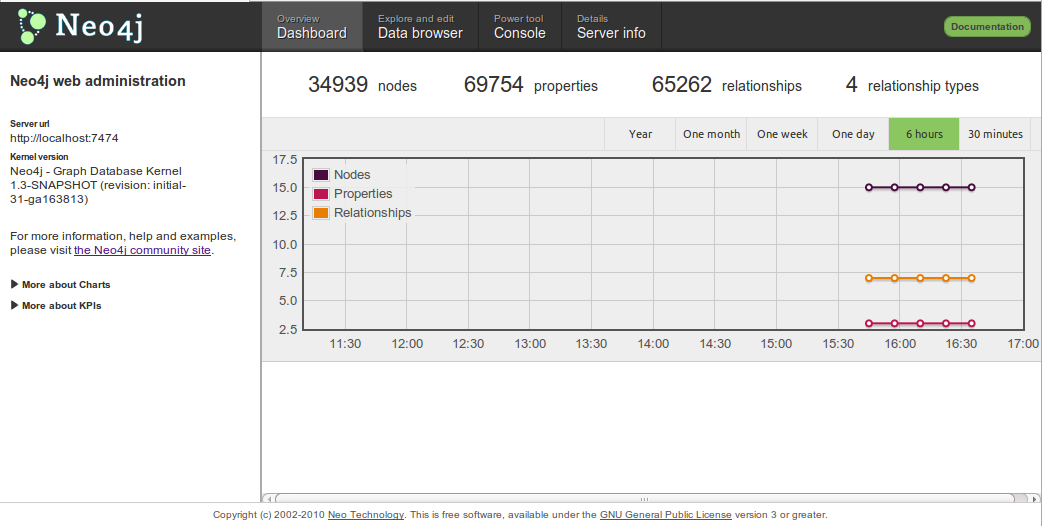
The Dashboard tab provides an overview of a running Neo4j instance.
The charts show entity counts over time: node, relationship and properties.
Copyright © 2011 Neo Technology